 Catalogo de metadatos del IGME
Quaternary
Type of resources
Available actions
Topics
Keywords
Contact for the resource
Provided by
Years
Formats
Representation types
Update frequencies
status
Service types
Scale
-

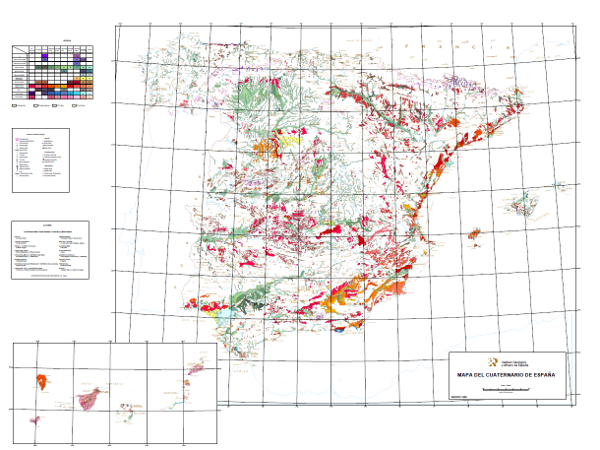
A database of faults showing geological evidence of activity during the Quaternary period in Iberia (last 2.6 million years according to the official limit set by IQS in 2009). The Quaternary Active Fault Database of Iberia (QAFI) is a project under constant revision and updating as a consequence of the advancing studies and knowledge on the structures capable of generating earthquakes in Iberia. QAFI could never be considered complete or definitive, due to the scientific nature of the data that contains in it as well as for the modus operandi followed in its construction: the altruist cooperation of a large number of Earth science researchers. The database (mdb. and shp. format) is hosted and maintained by the Geological Survey of Spain (IGME) and is accessible to the research and technical community and to society in general.
-
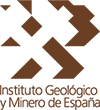
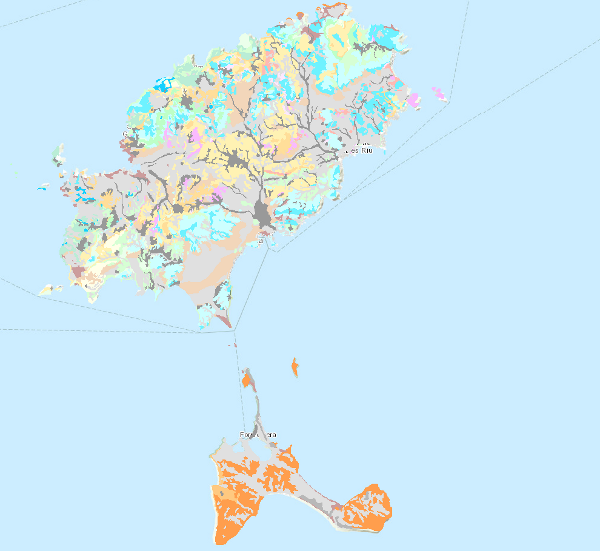
This map shows deposits dated as Plio-Pleistocene to contemporary, classified in 10 geochronological intervals and separated according to their genesis. Glacial, volcanic, karstic, aeolian, littoral, edaphic, palaeontological and prehistoric entities are included.
-
ZESIS is a database of seismogenic zones of the Iberian Peninsula and territories of influence developed for the calculation of the update of the seismic hazard map of Spain (IGN-UPM, 2013). ZESIS is the result of the evolution of three successive models in which numerous researchers from national and international research centres have collaborated, and of the synergy of the FASEGEO (CGL2009-09726), SHARE (FP7-226967), IBERFAULT (CGL2009-07388), OPPEL (IGN-UPM) and SISMOGEN (IGME) projects
-
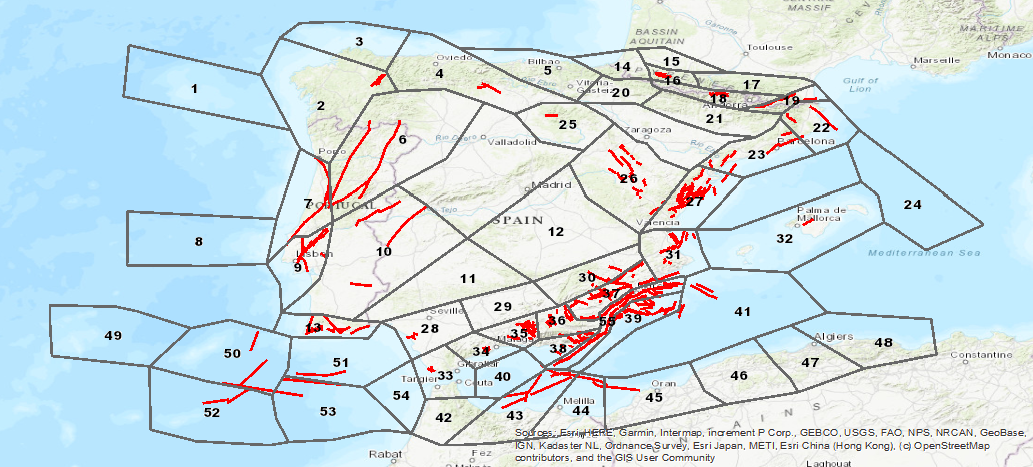
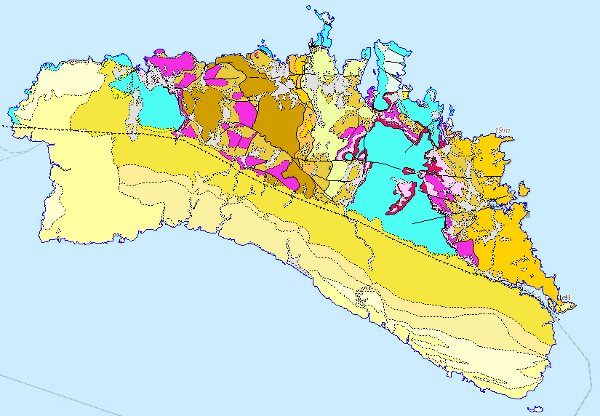
The Map of Geological Ages of the Iberian Peninsula, Balearic and Canary Islands at a scale of 1:1,000,000 is a map produced by the Geological Survey of Spain (IGME) based on the Geological Map of the Iberian Peninsula, Balearic and Canary Islands published in 1995. The cartographic units represented in it have been established by means of chronostratigraphic criteria, which have been specified down to the Series. The chronostratigraphic classification used was the "International Stratigraphic Chart" published in 2008 and drawn up by the International Commission on Stratigraphy of the International Union of Geological Sciences (IUGS). The igneous and metamorphic rocks have been assigned the corresponding chronostratigraphic section. The geological information for the Iberian Peninsula and the Balearic Islands is in UTM projection, zone 30, Postdam datum. The information on the Canary Islands is in UTM projection, zone 28, datum Pico de las Nieves. The map is distributed free of charge in shape format.
-
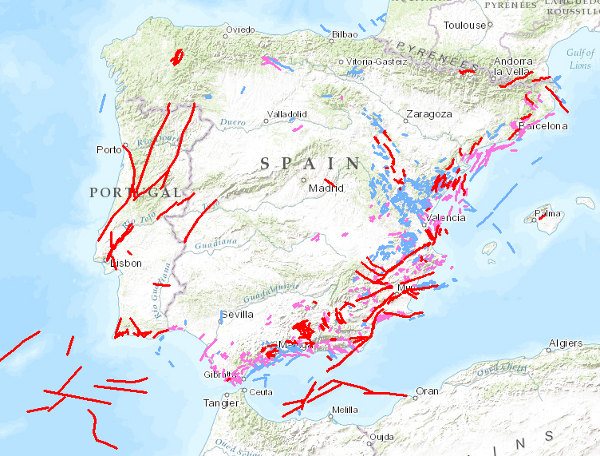
Visualisation service of QAFI, a database of faults with geological evidence of proven activity during the Quaternary period (the last 2.6 million years according to the limit officially established by the SQS in 2009) of the Iberian Peninsula. It is a project in constant revision and updating as a result of the progress of studies and knowledge about the structures capable of generating earthquakes in Iberia, and can never be considered complete or definitive, both because of the scientific nature of the data contained in it, and because of the modus operandi used in its construction: the altruistic collaboration of numerous researchers in Earth Sciences.
-
This Map depicts the materials or rocks that appear on the surface of the sheet, their spatial distribution, nature and geometrical relationships. The cartographic units are chronostratigraphic groupings, with common lithology and age formed by strata which are called formations, groups or members; other non-stratified ones such as granites are represented. The structural relationships between them are expressed by symbols, which gives the map a three-dimensional character that is completed by additional geological profiles. These are the graphic expression of the deep geometrical arrangement of the units shown on the geological map. Applied information such as water points, mineral deposits and indications, presence of fossils and other elements of punctual representation are added by means of symbology. The digital information, geological map 1:100.000, chronolithostratigraphic legend and legend of geological symbols, is stored in coverage format (ESRI). There is a guide that reflects its organisation and codification. The creation of this cartography is based on the compilation of existing information, mainly MAGA cartography at a scale of 1:50,000, doctoral theses and other research work.
-
QAFI is a database of faults with geological evidence of proven activity during the Quaternary period (the last 2.6 million years according to the limit officially established by the SQS in 2009) of the Iberian Peninsula. It is a project in constant revision and updating as a result of the progress of studies and knowledge about the structures capable of generating earthquakes in Iberia, and can never be considered complete or definitive, both because of the scientific nature of the data contained in it, and because of the modus operandi used in its construction: the altruistic collaboration of numerous researchers in Earth Sciences. QAFI, both in Access format and geospatially represented, is hosted and maintained by the Geological Survey of Spain (IGME), and is accessible to the entire scientific and technical community and society in general.
-
Database visualization service of seismogenic zones of the Iberian Peninsula and territories of influence for the calculation of seismic hazard in Spain (ZESIS)
-
Map showing the chronolithostratigraphic units of the area covered by the sheet separated by different types of contacts: normal or concordant, discordant and mechanical or intrusive. The tectonic structure is represented by the cartographic traces of the folds, the orientation and dip of the planar and linear elements contained in the rocks, as well as by the structural relationship -by means of faults and thrusts- between the rock assemblages differentiated cartographically. The map is accompanied by the lithostratigraphic legend and conventional signs.
-
This 1:1,000,000 scale map shows the Plio-Pleistocene to contemporary deposits classified in 10 geochronological intervals and separated according to their genesis. It also includes glacial, volcanic, karstic, aeolian, coastal, edaphic, palaeontological and prehistoric phenomena. It has been carried out by the Geological Survey of Spain (then called the GeoMining Technological Institute of Spain) with the collaboration of experts mainly from the academic world and public research centres. It covers the entire national territory, including the archipelagos, with the exception of Melilla.