Neogene
Type of resources
Available actions
Topics
Provided by
Representation types
Update frequencies
status
Service types
Scale
-
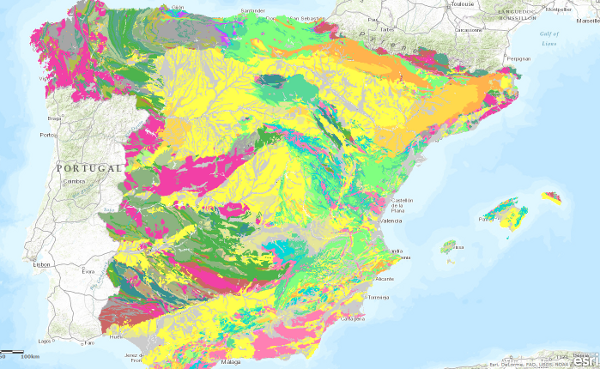
The Map of Geological Ages of the Iberian Peninsula, Balearic and Canary Islands at a scale of 1:1,000,000 is a map produced by the Geological Survey of Spain (IGME) based on the Geological Map of the Iberian Peninsula, Balearic and Canary Islands published in 1995. The cartographic units represented in it have been established by means of chronostratigraphic criteria, which have been specified down to the Series. The chronostratigraphic classification used was the "International Stratigraphic Chart" published in 2008 and drawn up by the International Commission on Stratigraphy of the International Union of Geological Sciences (IUGS). The igneous and metamorphic rocks have been assigned the corresponding chronostratigraphic section. The geological information for the Iberian Peninsula and the Balearic Islands is in UTM projection, zone 30, Postdam datum. The information on the Canary Islands is in UTM projection, zone 28, datum Pico de las Nieves. The map is distributed free of charge in shape format.
-
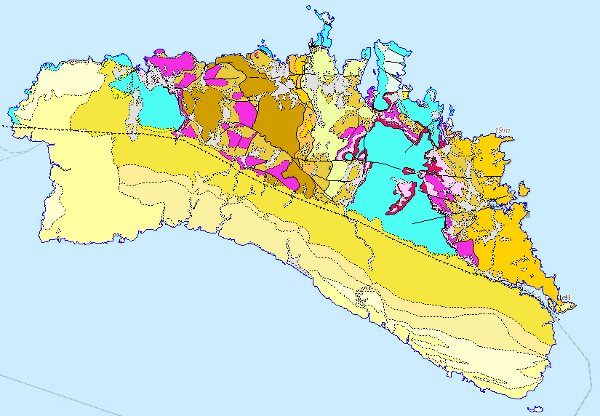
This Map depicts the materials or rocks that appear on the surface of the sheet, their spatial distribution, nature and geometrical relationships. The cartographic units are chronostratigraphic groupings, with common lithology and age formed by strata which are called formations, groups or members; other non-stratified ones such as granites are represented. The structural relationships between them are expressed by symbols, which gives the map a three-dimensional character that is completed by additional geological profiles. These are the graphic expression of the deep geometrical arrangement of the units shown on the geological map. Applied information such as water points, mineral deposits and indications, presence of fossils and other elements of punctual representation are added by means of symbology. The digital information, geological map 1:100.000, chronolithostratigraphic legend and legend of geological symbols, is stored in coverage format (ESRI). There is a guide that reflects its organisation and codification. The creation of this cartography is based on the compilation of existing information, mainly MAGA cartography at a scale of 1:50,000, doctoral theses and other research work.
-
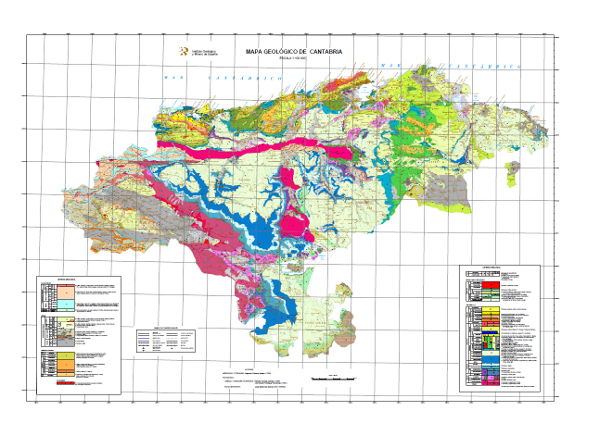
Map showing the chronolithostratigraphic units of the area covered by the sheet separated by different types of contacts: normal or concordant, discordant, intrusive and other. The tectonic structure is represented by the cartographic traces of folds, the orientation and dip of planar and linear elements contained in the rocks, as well as by the structural relationship - by means of faults and thrusts - between the rock assemblages differentiated cartographically. The map is accompanied by the lithostratigraphic legend and conventional signs.
-
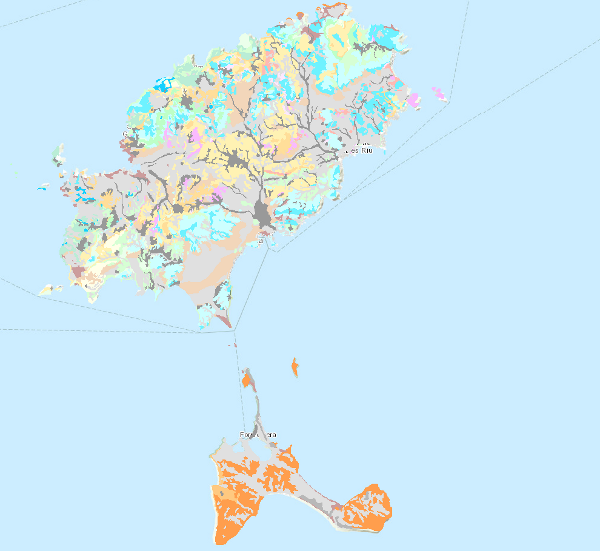
Map showing the chronolithostratigraphic units of the area covered by the sheet separated by different types of contacts: normal or concordant, discordant and mechanical or intrusive. The tectonic structure is represented by the cartographic traces of the folds, the orientation and dip of the planar and linear elements contained in the rocks, as well as by the structural relationship -by means of faults and thrusts- between the rock assemblages differentiated cartographically. The map is accompanied by the lithostratigraphic legend and conventional signs.
-

Map showing the chronolithostratigraphic units of the area covered by the sheet separated by different types of contacts: normal or concordant, discordant and mechanical or intrusive. The tectonic structure is represented by the cartographic traces of the folds, the orientation and dip of the planar and linear elements contained in the rocks, as well as by the structural relationship -by means of faults and thrusts- between the rock assemblages differentiated cartographically.
 Catalogo de metadatos del IGME