General geology.rock
Type of resources
Available actions
Topics
Keywords
Contact for the resource
Provided by
Representation types
Update frequencies
status
Service types
Scale
-
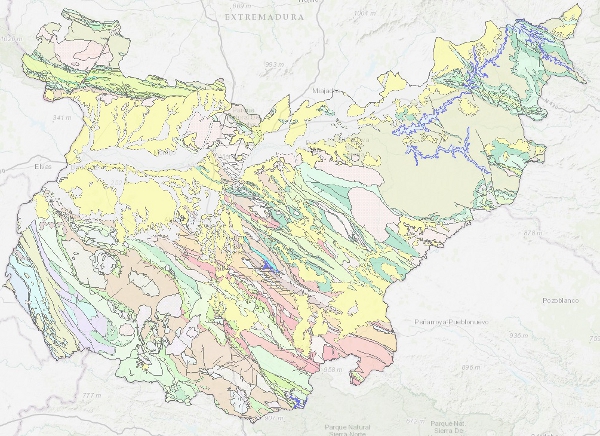
Map with the chronolithostratigraphic and igneous units of the province of Badajoz grouped together as a support for the mapping of mineral resources in the province. The contacts between the different cartographic units have been classified as "stratigraphic contact" and "intrusive contact". The tectonic structure is expressed by faults.
-
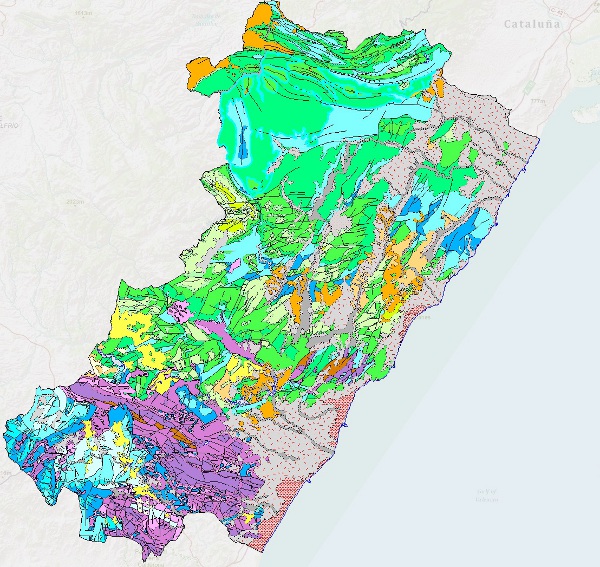
Map showing the geological units classified according to chronostratigraphic and lithological criteria from the point of view of mineral resources. Each cartographic unit has an associated description and geological age. The geological and tectonic structure is represented by faults, thrusting and folding structures. This map, which covers the entire province of Castellón, has been drawn up by the Geological Survey of Spain as part of the "Basic Master Plan for the Natural Mineral Resources of the Valencian Community", the result of the Singularised Collaboration Agreement between the Department of Industry and Commerce of the Valencian Regional Government and the IGME in the field of research and management of the natural mineral resources of the Valencian Community. The agreement was signed in 2000, and work began that same year. The geological mapping of the province of Castellón was completed in 2002. It was carried out using the existing geological cartography of the Geological Map of Spain at a scale of 1:50,000, MAGNA, and the available geological cartography at a scale of 1:200,000. The information is in coverage format (ESRI) and is made up of a file with the cartographic units, contacts and faults, a file with the folding structures, a file with the lithostratigraphic legend and a file with the conventional geological symbols. The geological description, the geological age and the representation codes of the geological units can be found in three tables.
-
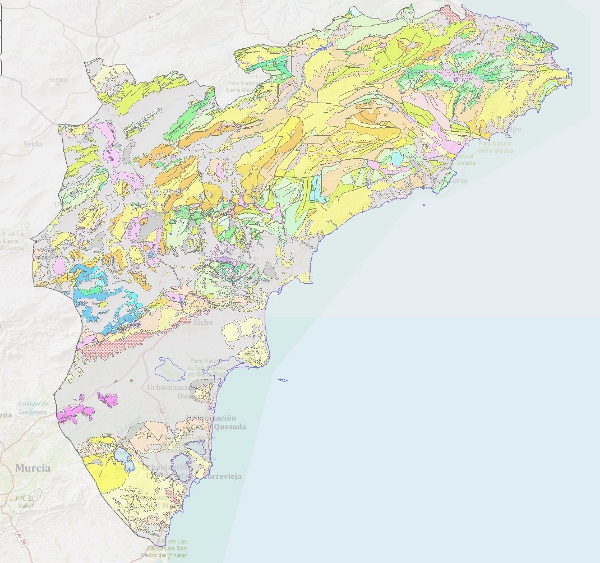
Map showing the geological units classified according to chronostratigraphic and lithological criteria from the point of view of mineral resources. Each cartographic unit has an associated description and geological age. The geological and tectonic structure is represented by faults, thrusting and folding structures. This map, which covers the entire province of Alicante, has been drawn up by the Geological Survey of Spain as part of the "Basic Master Plan for the Natural Mineral Resources of the Valencian Community", the result of the Singularised Collaboration Agreement between the Department of Industry and Trade of the Valencian Regional Government and the IGME in the field of research and management of the natural mineral resources of the Valencian Community. The agreement was signed in 2000, and work began that same year. The geological mapping of the province of Alicante was completed in 2002. It was carried out using the existing geological cartography of the Geological Map of Spain at a scale of 1:50,000, MAGNA, and the available geological cartography at a scale of 1:200,000. The information is in coverage format (ESRI) and consists of a file with the cartographic units, contacts and faults, a file with the folding structures, a file with the lithostratigraphic legend and a file with the conventional geological symbols. The geological description, the geological age and the representation codes of the geological units can be found in three tables.
-
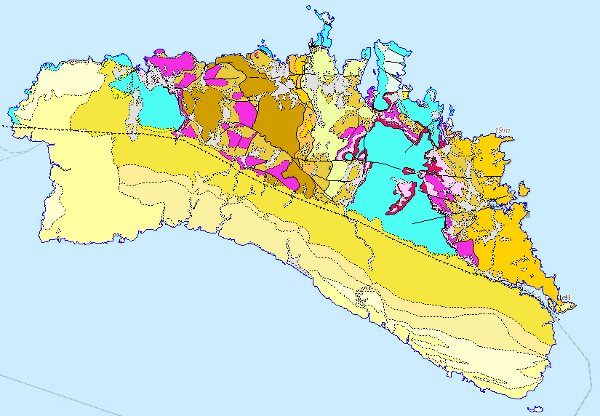
This Map depicts the materials or rocks that appear on the surface of the sheet, their spatial distribution, nature and geometrical relationships. The cartographic units are chronostratigraphic groupings, with common lithology and age formed by strata which are called formations, groups or members; other non-stratified ones such as granites are represented. The structural relationships between them are expressed by symbols, which gives the map a three-dimensional character that is completed by additional geological profiles. These are the graphic expression of the deep geometrical arrangement of the units shown on the geological map. Applied information such as water points, mineral deposits and indications, presence of fossils and other elements of punctual representation are added by means of symbology. The digital information, geological map 1:100.000, chronolithostratigraphic legend and legend of geological symbols, is stored in coverage format (ESRI). There is a guide that reflects its organisation and codification. The creation of this cartography is based on the compilation of existing information, mainly MAGA cartography at a scale of 1:50,000, doctoral theses and other research work.
-
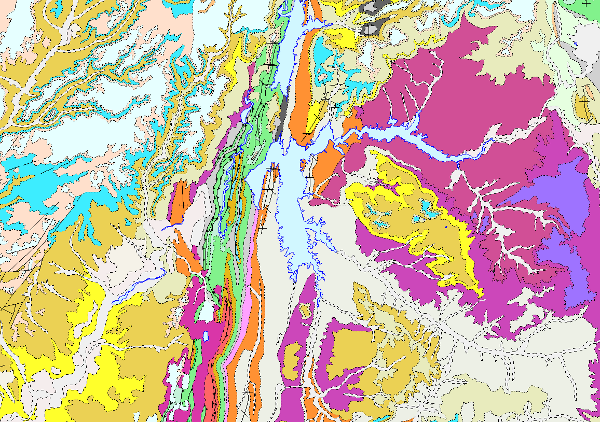
The continuous lithostratigraphic map of Spain in digital format at a scale of 1:200,000 represents the cartographic units characterised mainly according to lithostratigraphic and hydrogeological criteria. The criteria maintained to consider their cartographic representation are to maintain those units that present an important lithostratigraphic development, both for their representation and their singularity, also incorporating those that show a high hydrogeological interest, either because of their lithological nature (high permeability) or because they are considered to form an essential part of the definition of the aquifer. The contacts between the cartographic units represented were normal, unconformable and intrusive contacts. Faults, thrusts and folding structures are represented. Thus, a continuous map has been obtained in digital format, in which there are still areas with a higher density of cartographic information than others, either because they come from synthesis maps made with less general criteria than these, or because for their preparation, smaller scale cartographies (e.g. 1:50,000) have been used, thus obtaining a much richer and more detailed cartography. This map is the basis of the permeability and hydrogeological maps of Spain at a scale of 1:200,000 continuous and in digital format. This cartography is adapted to the hydrographic network and the shadow model made by CEDEX, at a scale of 1:200,000, from the topographic base, at a scale of 1:50,000, of the Army Cartographic Service. The cartographic information is referenced to coordinates in UTM projection, European Datum, zone 30, except for that corresponding to the Canary Islands, which is referenced to zone 28. The map is made up of the following information layers: Cartographic Units (LPLIT), Contacts and Fractures (LPCYF) and Folding Structures (LPEST). The format of the information generated is Shape file.
-
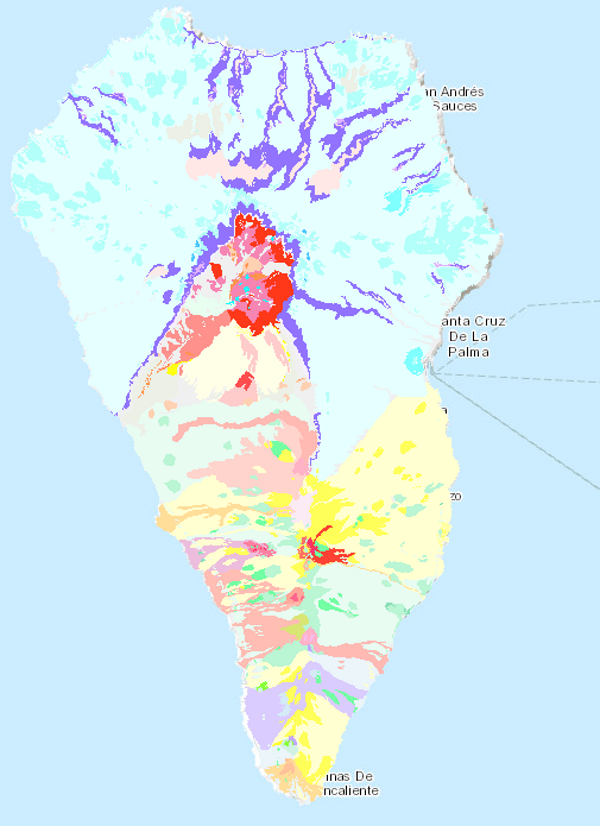
The map of the island of La Palma includes volcanic and sedimentary units separated by different types of contacts: undifferentiated between formations, between lava flows of the same formation and intrusive. The different units have been grouped into different categories according to their genesis, structure and arrangement, such as eruptions, edifices or volcanoes. The direction of the flow lava flows is shown by means of the corresponding symbology. Tectonic processes are shown as faults and recent local features as active slumps. Additional information includes mineral deposits and indications, archaeological sites and other volcanic elements of specific representation. The map is accompanied by the chronolithostratigraphic legend and conventional signs.
-
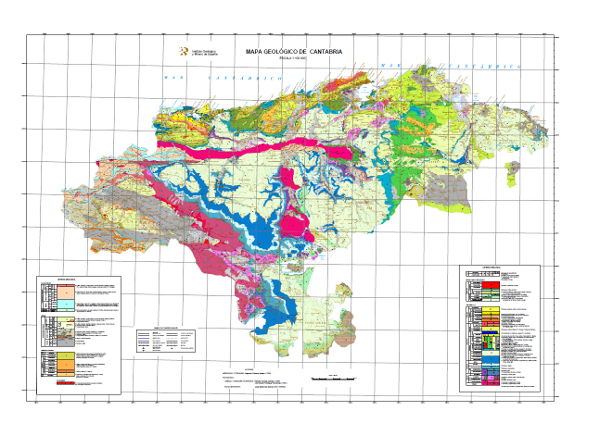
Map showing the chronolithostratigraphic units of the area covered by the sheet separated by different types of contacts: normal or concordant, discordant, intrusive and other. The tectonic structure is represented by the cartographic traces of folds, the orientation and dip of planar and linear elements contained in the rocks, as well as by the structural relationship - by means of faults and thrusts - between the rock assemblages differentiated cartographically. The map is accompanied by the lithostratigraphic legend and conventional signs.
-
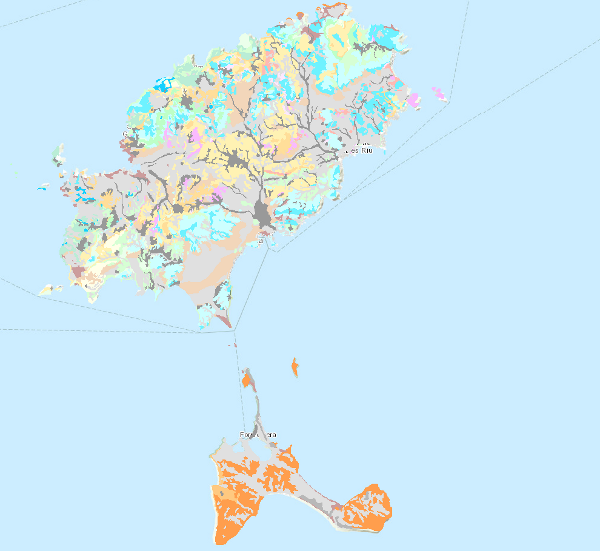
Map showing the chronolithostratigraphic units of the area covered by the sheet separated by different types of contacts: normal or concordant, discordant and mechanical or intrusive. The tectonic structure is represented by the cartographic traces of the folds, the orientation and dip of the planar and linear elements contained in the rocks, as well as by the structural relationship -by means of faults and thrusts- between the rock assemblages differentiated cartographically. The map is accompanied by the lithostratigraphic legend and conventional signs.
-

Map showing the chronolithostratigraphic units of the area covered by the sheet separated by different types of contacts: normal or concordant, discordant and mechanical or intrusive. The tectonic structure is represented by the cartographic traces of the folds, the orientation and dip of the planar and linear elements contained in the rocks, as well as by the structural relationship -by means of faults and thrusts- between the rock assemblages differentiated cartographically.
 Catalogo de metadatos del IGME