General geology
Type of resources
Available actions
Topics
Provided by
Representation types
Update frequencies
status
Service types
Scale
-
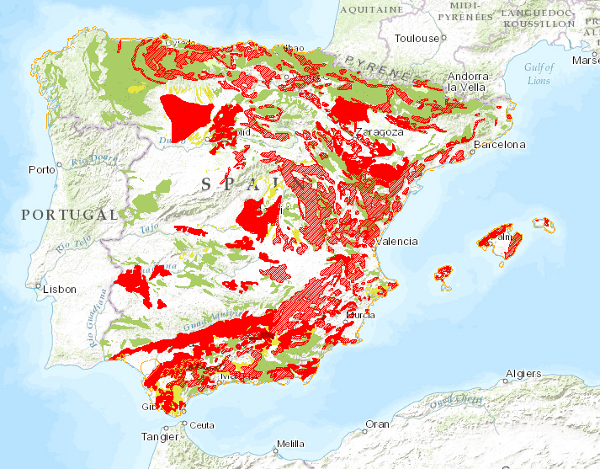
Map delimiting the areas with different types of land movements, representing the most intense and frequent movements. It therefore shows the distribution and extent of the most problematic areas from a practical point of view. Land movements are classified into four main groups: horizontal component movements (landslides and landslides), vertical component movements (subsidence and subsidence, and expansive clays), unstable processes in coastal areas and movements related to mining operations. Areas with significant erosion processes are also included. This map, published in 1987, was drawn up entirely by staff of the Geological Survey of Spain in response to the need for information on geological hazards and risks on a national scale.
-
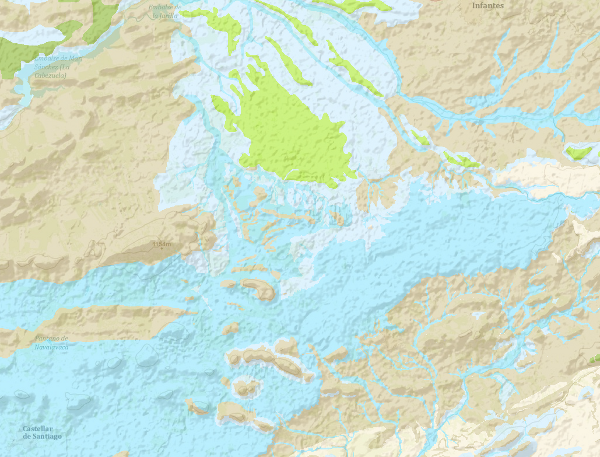
The continuous Hydrogeological Map of Spain in digital format at a scale of 1:200,000 is based on the Lithostratigraphic and Permeability Map of Spain, continuous at a scale of 1:200,000 and represents the mapped lithostratigraphic levels, grouped by range of permeability and the associated lithologies, and represented with a certain colour and tone, so that it is possible to visualise the areas associated with the different aquifers on the map. Blue colours represent porous aquifers, green colours represent fissured or karstic aquifers and brown colours represent impermeable or low permeability formations. Productivity is represented by the tone, in the case of permeable formations, dark tones indicate greater productivity and in the case of impermeable formations indicate greater impermeability. For the preparation of the Hydrogeological Map, once it had been verified that the formations that make up the main aquifers were cartographically differentiated on the Lithostratigraphic and Permeability Map of Spain, a hydrogeological legend was drawn up, grouping them according to their permeability, geometry, hydraulic relationship and hydrogeological functioning. This work was carried out taking into account the existing information on the different aquifers in Spain as well as the groundwater bodies defined in accordance with the Water Framework Directive (WFD). The continuous Hydrogeological Map of Spain in digital format at a scale of 1:200,000,000 arises from the need for a continuous map of the entire national territory on which to capture the information and distribution of the groundwater bodies (m.a.s). This cartography is adapted to the hydrographic network and the shadow model made by CEDEX, at a scale of 1:20,000, from the topographic base, at a scale of 1:50,000, of the Army Cartographic Service. The cartographic information is referenced to coordinates in UTM projection, European Datum, zone 30, except for the Canary Islands, which is referenced to zone 28. The Hydrogeological Map is made up of a polygonal layer of cartographic units (LPLIT) and the external tables Hidro.dat and Descrip_hidro.dat. The format of the information generated is Shape file.
-
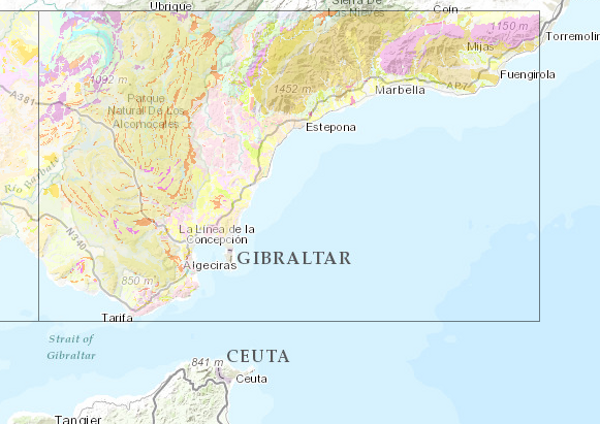
This Map depicts the materials or rocks that appear on the surface of the sheet, their spatial distribution, nature and geometric relationships. The cartographic units are chronostratigraphic groupings, with common lithology and age formed by strata which are called formations, groups or members; other non-stratified ones such as granites are represented. The structural relationships between them are expressed by symbols, which gives the map a three-dimensional character completed by additional geological profiles. These are the graphic expression of the deep geometrical arrangement of the units shown on the geological map. Applied information such as water points, mineral deposits and indications, presence of fossils and other elements of point representation are added by means of symbology. The printed sheets include geological sections, columns of the main zones or units and various diagrams (regional geological and tectonic diagrams, both at a scale of 1:1,000,000). The nominal scale of the series is 1:200,000, but in the island territories it has been produced at a scale of 1:100,000. The digital information, geological map 1:200,000, chronolithostratigraphic legend and legend of geological symbols, is stored in coverage format (ESRI). There is a guide reflecting its organisation and codification. The IGME is responsible for the execution of this series of cartography, which it finances with its own resources. The creation of this cartography is based on the compilation of existing information, mainly MAGA cartography at a scale of 1:50,000, doctoral theses and other research work.
-
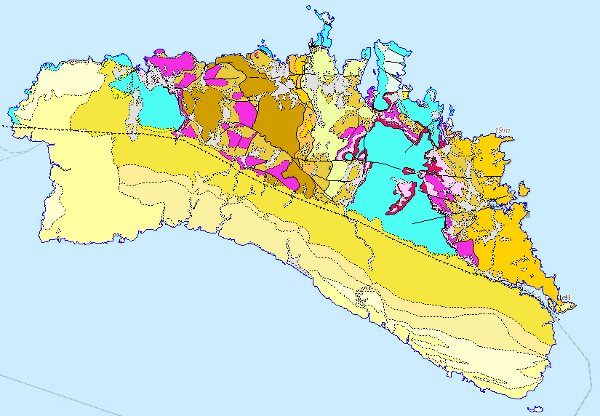
This Map depicts the materials or rocks that appear on the surface of the sheet, their spatial distribution, nature and geometrical relationships. The cartographic units are chronostratigraphic groupings, with common lithology and age formed by strata which are called formations, groups or members; other non-stratified ones such as granites are represented. The structural relationships between them are expressed by symbols, which gives the map a three-dimensional character that is completed by additional geological profiles. These are the graphic expression of the deep geometrical arrangement of the units shown on the geological map. Applied information such as water points, mineral deposits and indications, presence of fossils and other elements of punctual representation are added by means of symbology. The digital information, geological map 1:100.000, chronolithostratigraphic legend and legend of geological symbols, is stored in coverage format (ESRI). There is a guide that reflects its organisation and codification. The creation of this cartography is based on the compilation of existing information, mainly MAGA cartography at a scale of 1:50,000, doctoral theses and other research work.
-
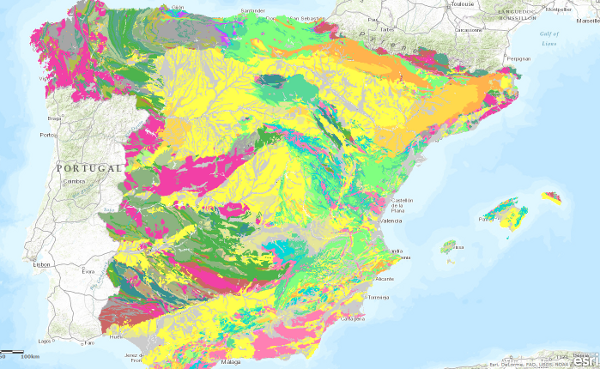
The Map of Geological Ages of the Iberian Peninsula, Balearic and Canary Islands at a scale of 1:1,000,000 is a map produced by the Geological Survey of Spain (IGME) based on the Geological Map of the Iberian Peninsula, Balearic and Canary Islands published in 1995. The cartographic units represented in it have been established by means of chronostratigraphic criteria, which have been specified down to the Series. The chronostratigraphic classification used was the "International Stratigraphic Chart" published in 2008 and drawn up by the International Commission on Stratigraphy of the International Union of Geological Sciences (IUGS). The igneous and metamorphic rocks have been assigned the corresponding chronostratigraphic section. The geological information for the Iberian Peninsula and the Balearic Islands is in UTM projection, zone 30, Postdam datum. The information on the Canary Islands is in UTM projection, zone 28, datum Pico de las Nieves. The map is distributed free of charge in shape format.
-
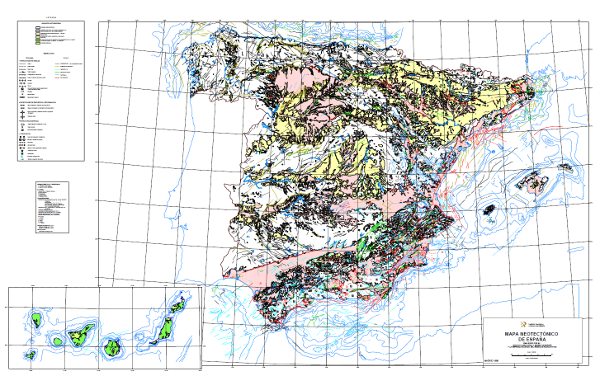
The Neotectonic Map expresses those structural, morphological, stratigraphic and other features that show relatively recent movements (from the period considered neotectonic), as well as the type of stress to which the peninsula is subjected. Its objectives are to identify deformations from the Middle Miocene - Upper Miocene boundary to the present day. The materials have been classified into six categories, two for volcanic materials differentiated by age; and four for the rest of the materials, with four subdivisions according to age. It also includes tectonic structures, stress and deformation directions, diapiric structures and other related phenomena, all with age expression. The map contains information on the Spanish continental shelf. This map, of national scope, has been produced by the Geological Survey of Spain in collaboration with the National Radioactive Waste Company (ENRESA).
-
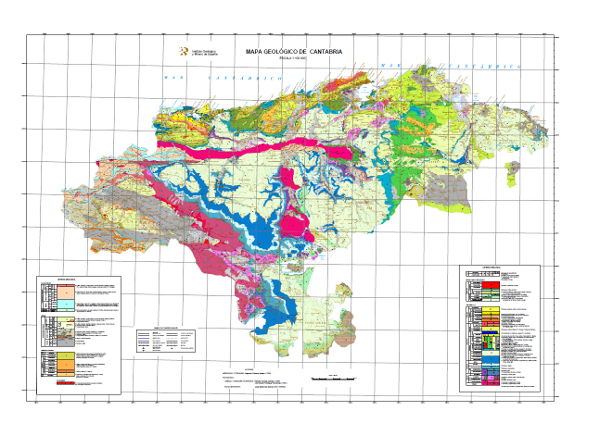
Map showing the chronolithostratigraphic units of the area covered by the sheet separated by different types of contacts: normal or concordant, discordant, intrusive and other. The tectonic structure is represented by the cartographic traces of folds, the orientation and dip of planar and linear elements contained in the rocks, as well as by the structural relationship - by means of faults and thrusts - between the rock assemblages differentiated cartographically. The map is accompanied by the lithostratigraphic legend and conventional signs.
-

Map showing the chronolithostratigraphic units of the area covered by the sheet separated by different types of contacts: normal or concordant, discordant and mechanical or intrusive. The tectonic structure is represented by the cartographic traces of the folds, the orientation and dip of the planar and linear elements contained in the rocks, as well as by the structural relationship -by means of faults and thrusts- between the rock assemblages differentiated cartographically.
-
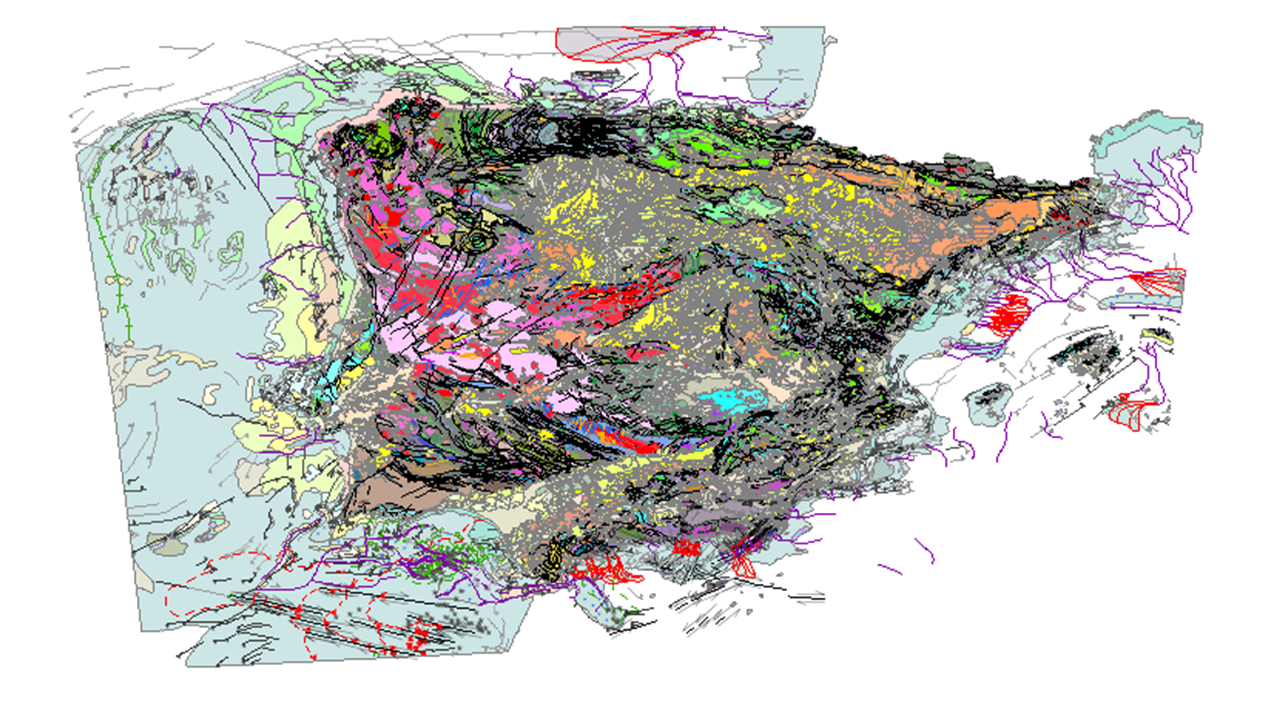
Geological map of Spain and Portugal at scale 1:1 000 000 of 2015 is an updated cartographic version of the Iberian Peninsula as well as Ceuta and Melilla and all the insular territory of Spain and Portugal: Balearic Islands, Canary Islands, Azores and Madeira, published periodically by the IGME in collaboration with the Geological Survey of Portugal (LNEG). This new version includes for the first time the geological cartography of the continental shelf and the Atlantic islands of Portugal. This map includes all the new geological knowledge that has resulted from the completion of the MAGNA series of 1:50,000 scale geological cartography of the IGME for the Spanish territory and the systematic series of cartography of the Portuguese territory developed by the LNEG. The continental part of the map has been composed from previous syntheses at a scale of 1:400,000 developed for each major geological unit in Spain, specifically, the Variscan Massif, the Pyrenees, the Baetic, Cantabrian and Iberian C. and the Cenozoic Basins of the Duero, Tagus and Ebro, and from the geological cartography at a scale of 1:200,000 produced in Portugal.
 Catalogo de metadatos del IGME