Geology
Type of resources
Available actions
Topics
Keywords
Contact for the resource
Provided by
Years
Formats
Representation types
Update frequencies
status
Service types
Scale
-
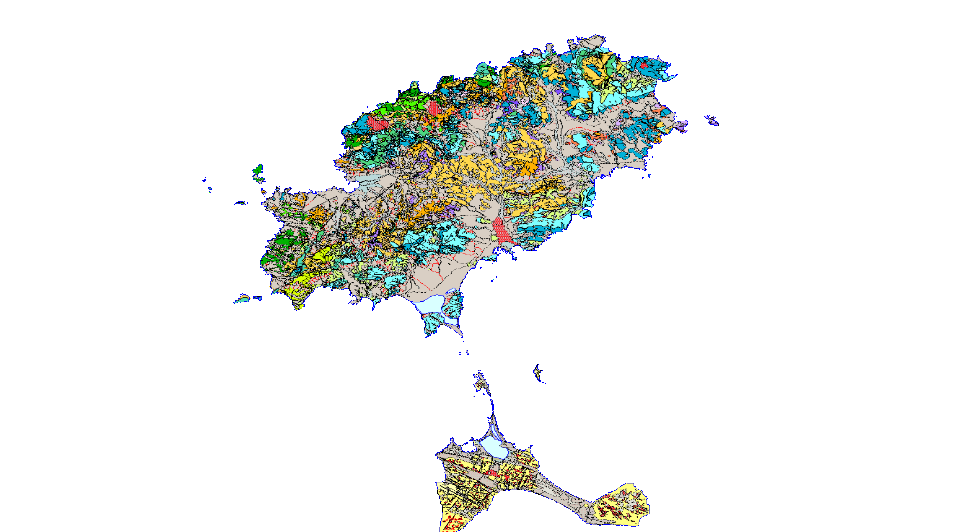
GEOLOGICAL CARTOGRAPHY is the representation of surface materials on the basis of their lithological, stratigraphic, structural, age, etc. characteristics. It is composed of the following levels of information: Z2211MRGEO: Cartographic units, differentiated geological enclosures; Z2211MPGEO: Geological enclosure labels; Z12211MLGEO: Auxiliary anchor lines of geological polygon labels; Z2211MLCON: Contact and fault lines. Linear entities of diverse origin; Z2211MPBUZ: Points and labels of point entities and structural measures.
-

Mapa con las unidades cronolitoestratigráficas de la provincia de Alicante acompañado de fallas y estructuras de plegamiento. Forma parte de una síntesis geológica unificada de la Comunidad Valenciana.
-
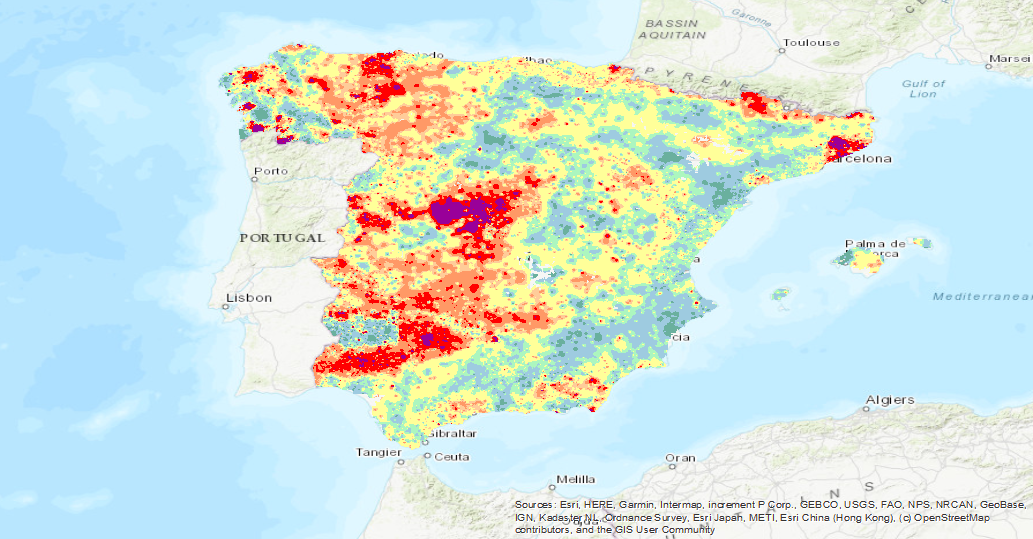
Iso-content maps of Lutetium (Lu), one of the chemical elements.obtained in the Geochemical Atlas of Spain Project, distributed in stream sediments (14,864 samples), superficial soils (0-20 cm.) (13,505 samples) and deeper soils (20-40 cm.) (7,682 samples). The results of the chemical analysis are shown in two types: total dissolution of the sample with 4 acids and partial dissolution with aqua regia. With the analytical results of all the sampled points, an isocontent map is made with adjustment to a square grid of 1,000 m by the method of interpolation of the inverse of the squared distance. The final result is a map for each type of sample and type of analysis carried out.
-
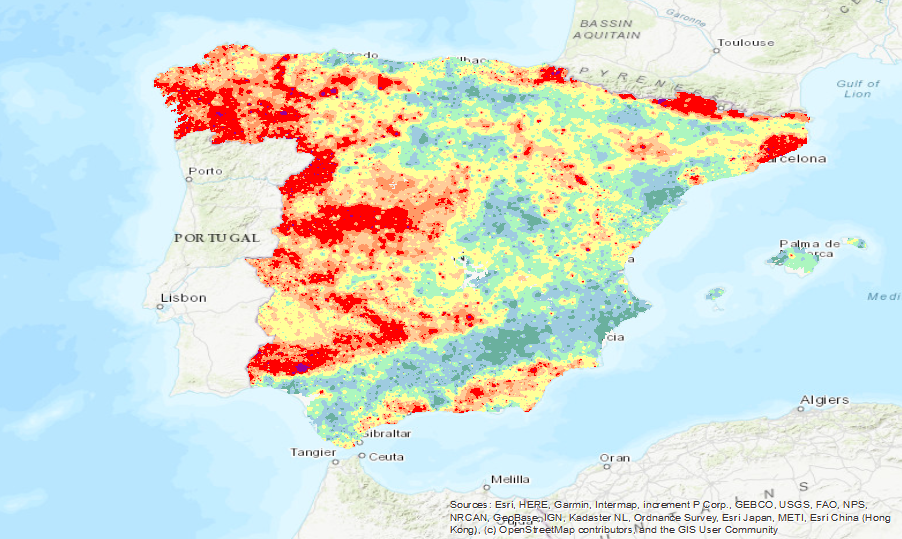
Iso-content maps of Aluminium (Al), one of the chemical elements.obtained in the Geochemical Atlas of Spain Project, distributed in stream sediments (14,864 samples), superficial soils (0-20 cm.) (13,505 samples) and deeper soils (20-40 cm.) (7,682 samples). The results of the chemical analysis are shown in two types: total dissolution of the sample with 4 acids and partial dissolution with aqua regia. With the analytical results of all the sampled points, an isocontent map is made with adjustment to a square grid of 1,000 m by the method of interpolation of the inverse of the squared distance. The final result is a map for each type of sample and type of analysis carried out.
-
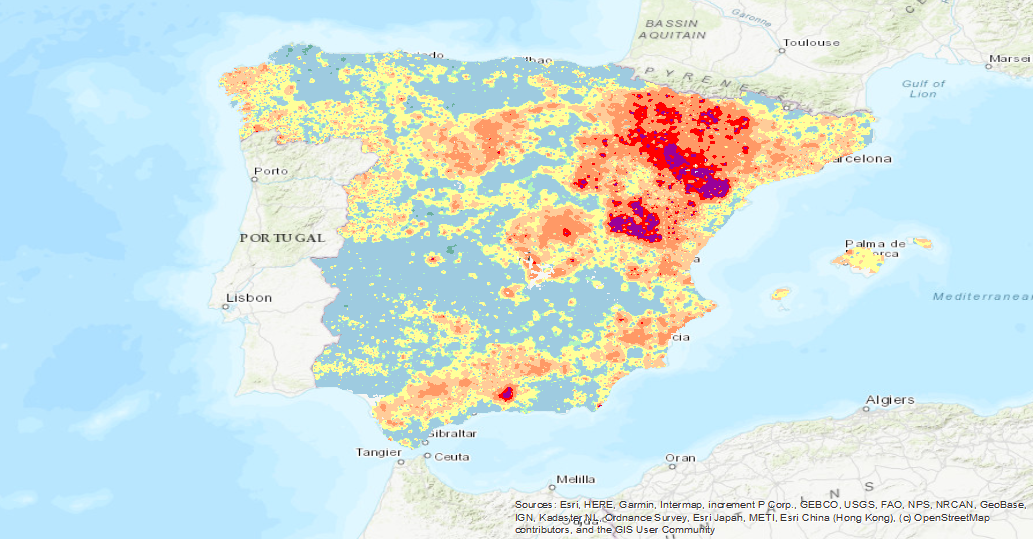
Iso-content maps of Tellurium (Te), one of the chemical elements.obtained in the Geochemical Atlas of Spain Project, distributed in stream sediments (14,864 samples), superficial soils (0-20 cm.) (13,505 samples) and deeper soils (20-40 cm.) (7,682 samples). The results of the chemical analysis are shown in two types: total dissolution of the sample with 4 acids and partial dissolution with aqua regia. With the analytical results of all the sampled points, an isocontent map is made with adjustment to a square grid of 1,000 m by the method of interpolation of the inverse of the squared distance. The final result is a map for each type of sample and type of analysis carried out.
-
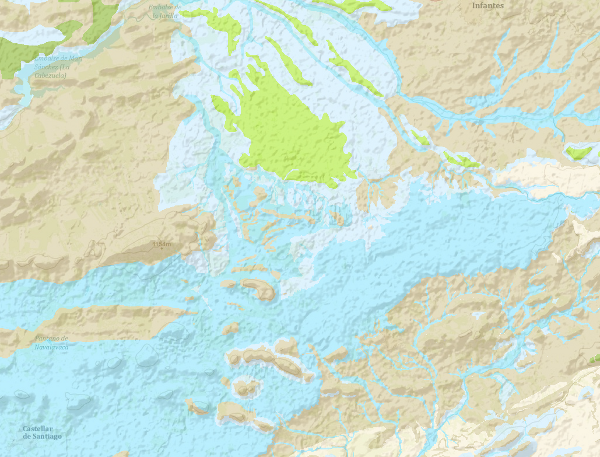
The continuous Hydrogeological Map of Spain in digital format at a scale of 1:200,000 is based on the Lithostratigraphic and Permeability Map of Spain, continuous at a scale of 1:200,000 and represents the mapped lithostratigraphic levels, grouped by range of permeability and the associated lithologies, and represented with a certain colour and tone, so that it is possible to visualise the areas associated with the different aquifers on the map. Blue colours represent porous aquifers, green colours represent fissured or karstic aquifers and brown colours represent impermeable or low permeability formations. Productivity is represented by the tone, in the case of permeable formations, dark tones indicate greater productivity and in the case of impermeable formations indicate greater impermeability. For the preparation of the Hydrogeological Map, once it had been verified that the formations that make up the main aquifers were cartographically differentiated on the Lithostratigraphic and Permeability Map of Spain, a hydrogeological legend was drawn up, grouping them according to their permeability, geometry, hydraulic relationship and hydrogeological functioning. This work was carried out taking into account the existing information on the different aquifers in Spain as well as the groundwater bodies defined in accordance with the Water Framework Directive (WFD). The continuous Hydrogeological Map of Spain in digital format at a scale of 1:200,000,000 arises from the need for a continuous map of the entire national territory on which to capture the information and distribution of the groundwater bodies (m.a.s). This cartography is adapted to the hydrographic network and the shadow model made by CEDEX, at a scale of 1:20,000, from the topographic base, at a scale of 1:50,000, of the Army Cartographic Service. The cartographic information is referenced to coordinates in UTM projection, European Datum, zone 30, except for the Canary Islands, which is referenced to zone 28. The Hydrogeological Map is made up of a polygonal layer of cartographic units (LPLIT) and the external tables Hidro.dat and Descrip_hidro.dat. The format of the information generated is Shape file.
-
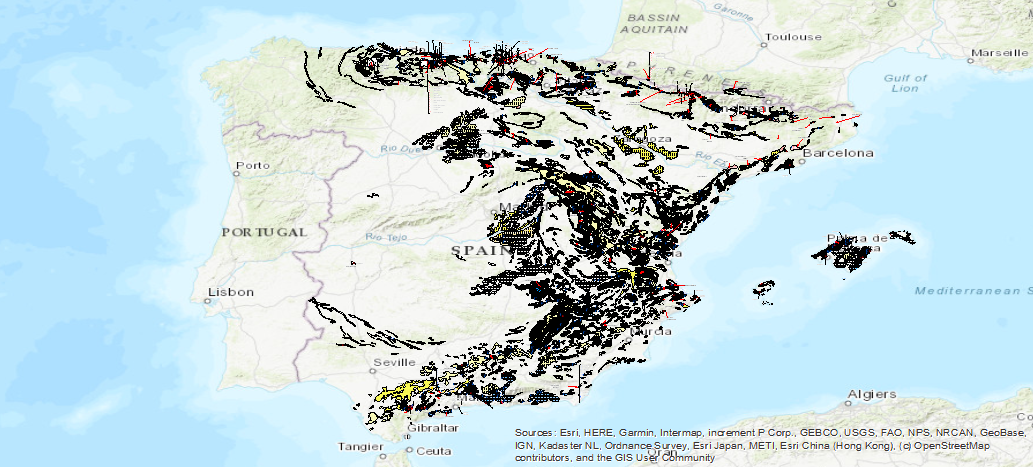
The Map of the Karst of Spain includes the different 'karstifiable' lithologies indicating their type (carbonates, gypsums and detritus), and the intensity of karstification in each of the areas. Also included are caves, poles, outcrops and other hydrogeological and geomorphological entities linked to karstification processes
-
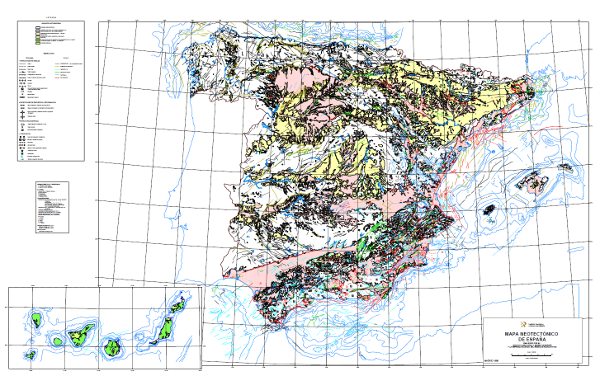
The Neotectonic Map expresses those structural, morphological, stratigraphic and other features that show relatively recent movements (from the period considered neotectonic), as well as the type of stress to which the peninsula is subjected. Its objectives are to identify deformations from the Middle Miocene - Upper Miocene boundary to the present day. The materials have been classified into six categories, two for volcanic materials differentiated by age; and four for the rest of the materials, with four subdivisions according to age. It also includes tectonic structures, stress and deformation directions, diapiric structures and other related phenomena, all with age expression. The map contains information on the Spanish continental shelf. This map, of national scope, has been produced by the Geological Survey of Spain in collaboration with the National Radioactive Waste Company (ENRESA).
-
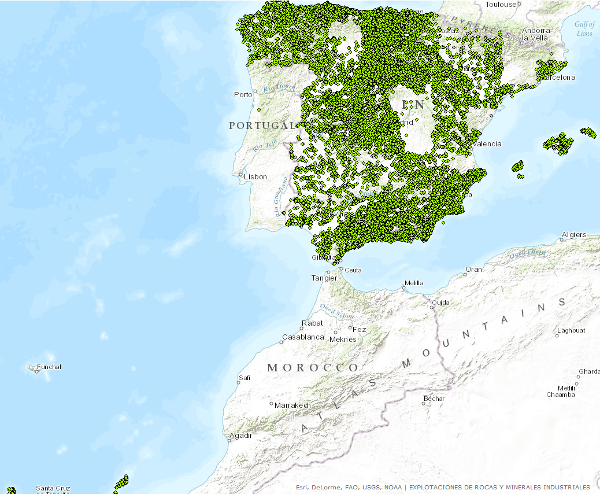
Points that symbolize the position of the indications or exploitations of Rocks and Industrial Minerals for all the national territory. Depending on the scale of visualization, two layers of points have been created. Exploitations I: represents only the location of the points. Visible from scales smaller than 1:200.000.Exploitations II: represents the location of the points with a symbolization according to different attributes. Visible from scales greater than 1:200,000. The reference systems offered by this service are: CRS:84, EPSG:4326, EPSG:4258, EPSG:4230, EPSG:23028, EPSG:23029, EPSG:23030, EPSG:23031, EPSG:25828, EPSG:25829, EPSG:25830, EPSG:25831. Puntos que simbolizan la posición de los indicios o explotaciones de Rocas y Minerales Industriales para todo el territorio nacional. En función de la escala de visualización se ha creado dos capas de puntos. Explotaciones I: representa tan sólo la localización de los puntos. Visible a partir de escalas menores de 1:200.000.Explotaciones II: representa la localización de los puntos con una simbolización en función de distintos atributos. Visible a partir de escalas mayores de 1:200.000.. Los sistemas de referencia que ofrece este servicio son:CRS:84, EPSG:4326, EPSG:4258, EPSG:4230, EPSG:23028, EPSG:23029, EPSG:23030, EPSG:23031, EPSG:25828, EPSG:25829, EPSG:25830, EPSG:25831..
 Catalogo de metadatos del IGME