Ecosystems
Type of resources
Available actions
Topics
Provided by
Representation types
Update frequencies
status
-

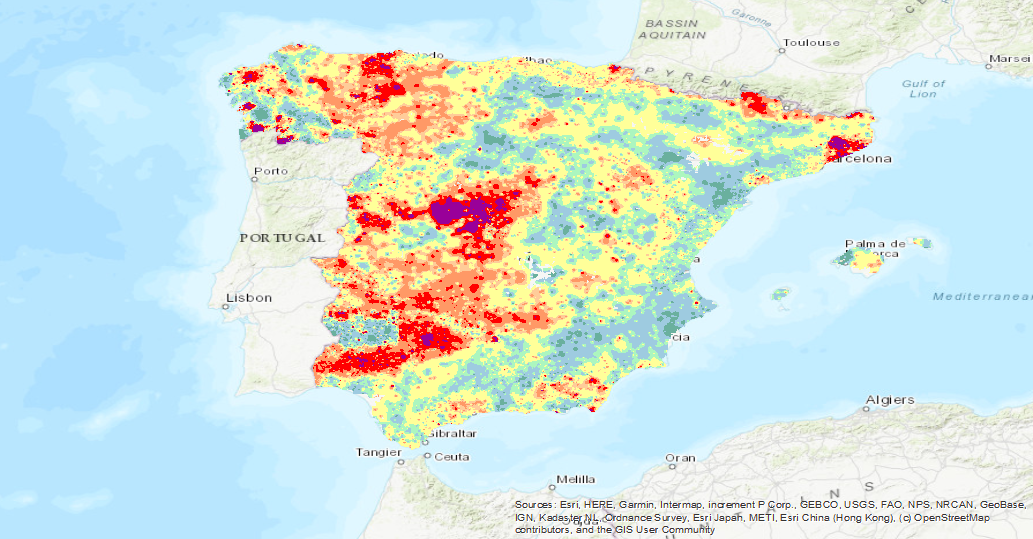
Iso-content maps of Lutetium (Lu), one of the chemical elements.obtained in the Geochemical Atlas of Spain Project, distributed in stream sediments (14,864 samples), superficial soils (0-20 cm.) (13,505 samples) and deeper soils (20-40 cm.) (7,682 samples). The results of the chemical analysis are shown in two types: total dissolution of the sample with 4 acids and partial dissolution with aqua regia. With the analytical results of all the sampled points, an isocontent map is made with adjustment to a square grid of 1,000 m by the method of interpolation of the inverse of the squared distance. The final result is a map for each type of sample and type of analysis carried out.
-

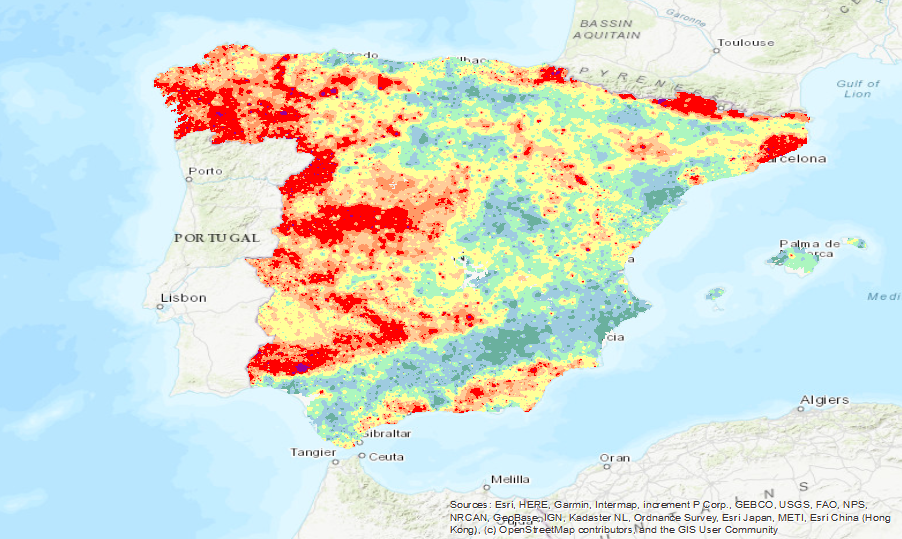
Iso-content maps of Aluminium (Al), one of the chemical elements.obtained in the Geochemical Atlas of Spain Project, distributed in stream sediments (14,864 samples), superficial soils (0-20 cm.) (13,505 samples) and deeper soils (20-40 cm.) (7,682 samples). The results of the chemical analysis are shown in two types: total dissolution of the sample with 4 acids and partial dissolution with aqua regia. With the analytical results of all the sampled points, an isocontent map is made with adjustment to a square grid of 1,000 m by the method of interpolation of the inverse of the squared distance. The final result is a map for each type of sample and type of analysis carried out.
-

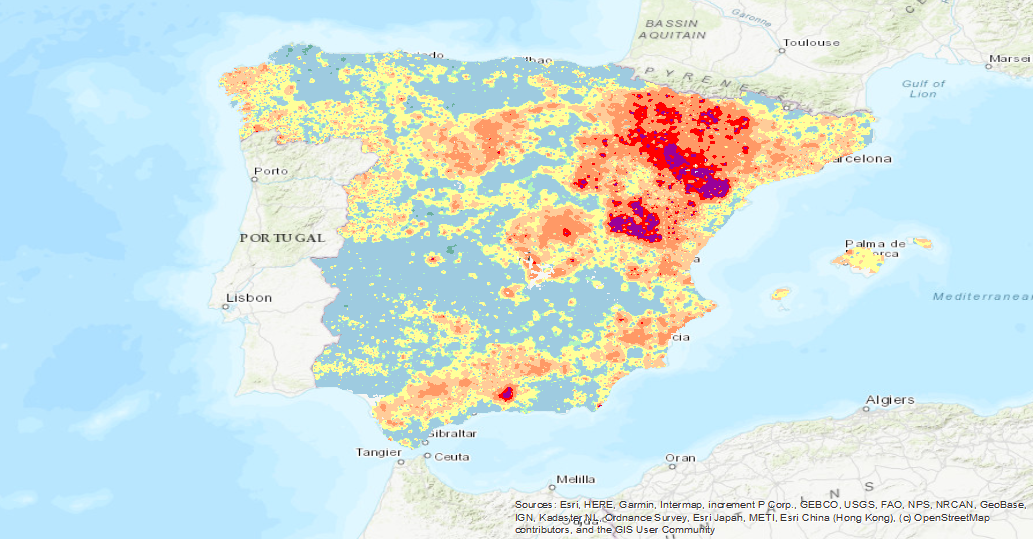
Iso-content maps of Tellurium (Te), one of the chemical elements.obtained in the Geochemical Atlas of Spain Project, distributed in stream sediments (14,864 samples), superficial soils (0-20 cm.) (13,505 samples) and deeper soils (20-40 cm.) (7,682 samples). The results of the chemical analysis are shown in two types: total dissolution of the sample with 4 acids and partial dissolution with aqua regia. With the analytical results of all the sampled points, an isocontent map is made with adjustment to a square grid of 1,000 m by the method of interpolation of the inverse of the squared distance. The final result is a map for each type of sample and type of analysis carried out.
 Catalogo de metadatos del IGME